Australian-built treasury risk intelligence, run entirely on your own infrastructure. Why that matters →
TraiQ Banking · Australian ADIs

One AI layer over the whole bank treasury.

An embedded treasury AI partner, a coherent model of how your bank takes and manages risk, and live monitoring across every risk family — built for Australian ADIs and mutuals, on your own infrastructure.

The platform on a live bank book — a two-and-a-half-minute tour.

Q — the AI core

The first-class AI feature, not an add-on.

Every install ships with Q — an embedded treasury AI partner with read access to your deal book, system-prompted in treasury vocabulary. It doesn't just chat; it analyses, simulates, reports, and reasons over your positions and your policies.

Analyses

Analyst-grade reads of the book — concentration, drivers, outliers — citing the exact deal IDs behind each figure.

Natural-language queries

Ask anything of your live position in plain English. Q resolves it across loans, deposits, derivatives, securities and FX.

Simulations

Rate shocks, funding stress, counterparty default — run multi-variable simulations across the whole balance sheet in seconds.

ALCO packs & reports

Generate board-ready ALCO packs and risk reports, drafted from live numbers and exportable for the committee.

What-if scenarios

Pose hypotheticals — "what if we add A$200m of 5-year fixed?" — and see the impact on ratios, NII and limits before you act.

Time-series modelling

Project balances, ratios and exposures forward over time, and track how the book has moved across snapshots.

Query your risk policies

Ask Q about your own limits, mandates and risk appetite — it reasons over the policies encoded into the platform, not just the data.

Create projects

Spin up a saved project — a funding review, a hedge proposal, a stress study — and have Q build, organise and revisit the analysis.

See it in action

The platform, on a live book.

A deeper walk through the cockpit — running on the Future Bank demo dataset. Click any screen to enlarge.
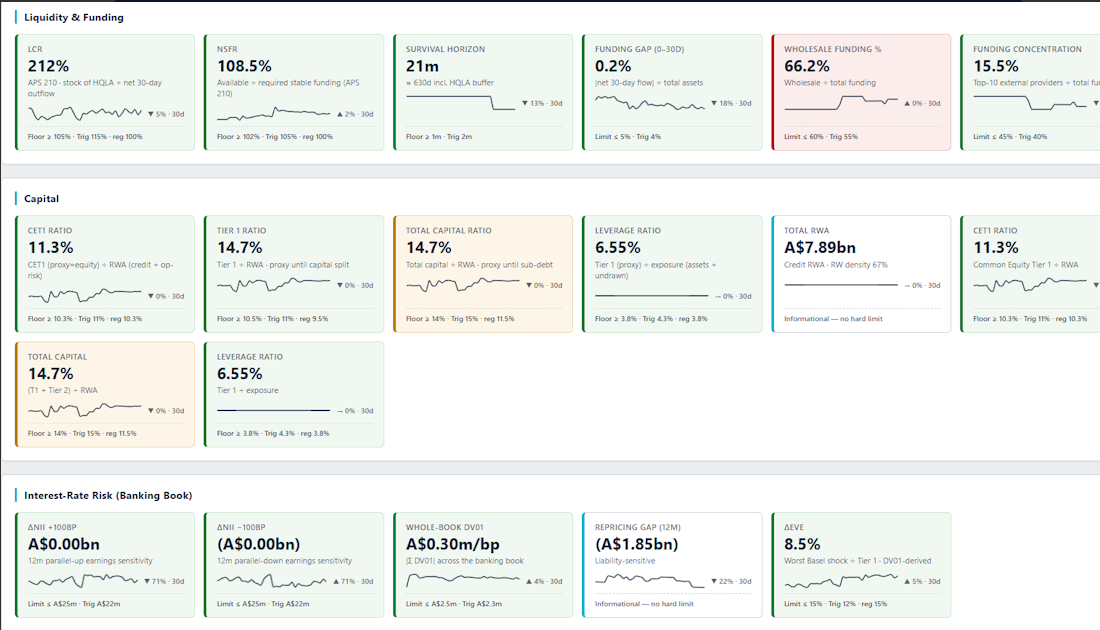
QFuture Bank · Risk CockpitDEMO DATASET
The risk cockpit: liquidity, capital and interest-rate-risk tiles, each against its floor and trigger
Risk cockpit

Every metric, live, against its limit.

Liquidity, capital and IRRBB tiles side by side — LCR, NSFR, survival horizon, CET1, ΔNII, whole-book DV01 — each with its floor and trigger and a 30-day trend. Green, amber and red mean one thing: where you stand against appetite. Every tile drills to the positions behind it.
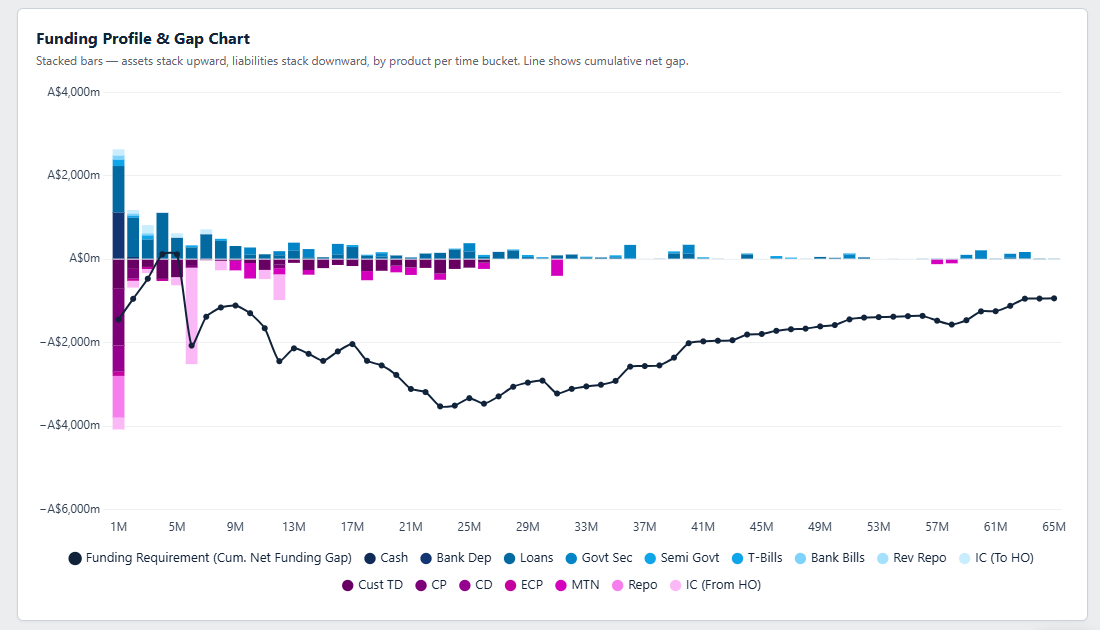
QFuture Bank · LiquidityDEMO DATASET
Funding profile and gap chart: assets stacked upward, liabilities downward by product per tenor bucket, with the cumulative net funding gap line
Liquidity · Funding profile

The maturity ladder, across every tenor bucket.

Assets stack up, liabilities stack down, product by product, with the cumulative net funding gap drawn across the whole ladder. The funding cliff and the survival horizon are visible at a glance — and every bar drills to the deals inside it.
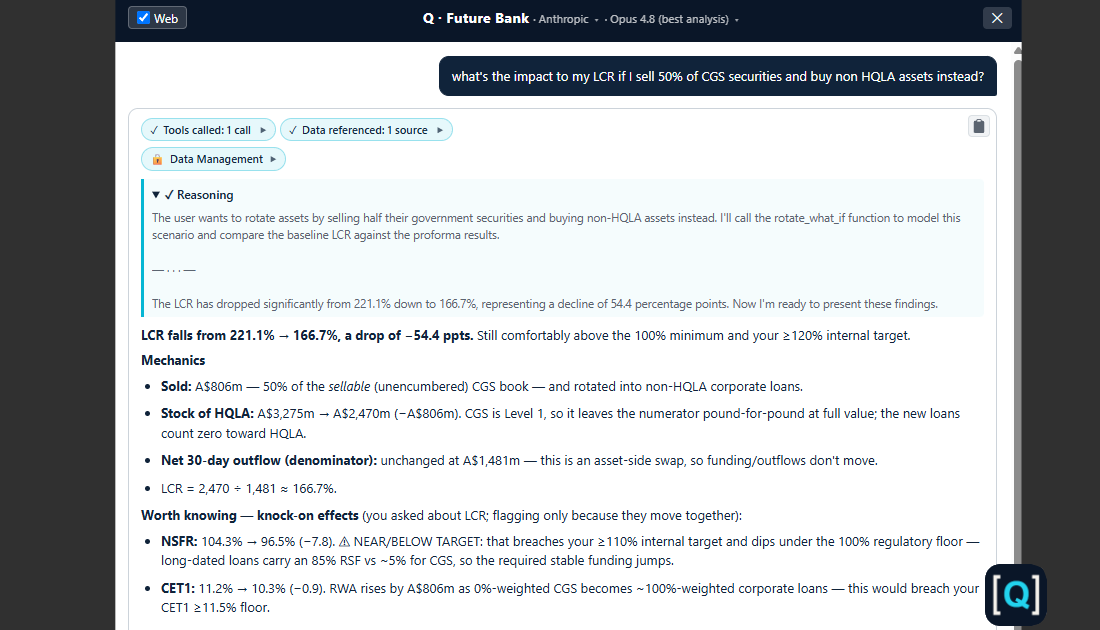
QQ · Future BankANTHROPIC · BYOK
Q answering a what-if question about LCR, showing the tools it called, its reasoning, and the mechanics of the answer
Q · What-if

Ask the book a question. Get an analyst's answer.

“What's the impact on my LCR if I sell 50% of CGS securities and buy non-HQLA assets instead?” Q calls the what-if engine, shows its reasoning, and answers with the mechanics — LCR 221% → 167% — then flags the NSFR and CET1 knock-on effects you didn't ask about but need to know.
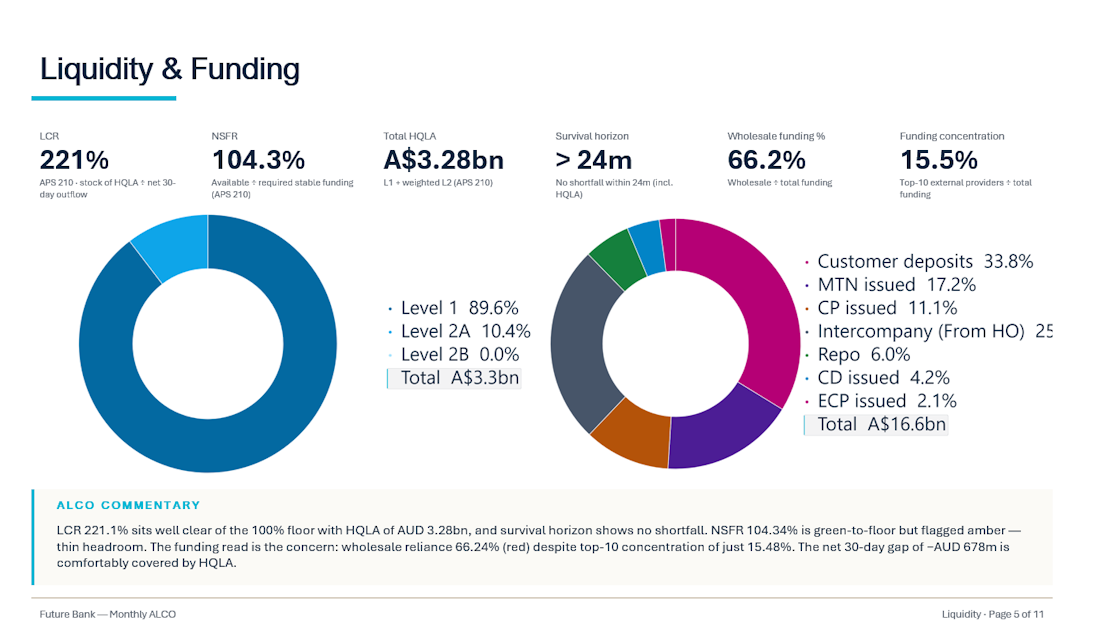
QFuture Bank · ALCO packGENERATED BY Q
A page of the generated ALCO pack: liquidity and funding ratios, HQLA composition, funding mix, and Q's commentary
ALCO pack

The committee pack, drafted from the live numbers.

Liquidity, rates and capital sections assembled into a board-ready ALCO pack — the ratios, the HQLA and funding mix, and Q's commentary on what changed and why — exportable for the meeting, with every figure traceable to source.

The TraiQ philosophy

How a treasury actually takes and manages risk.

TraiQ is built on one coherent model of the balance sheet. It's not a pile of disconnected reports — every number traces along the same chain, which is also how Q reasons about your book.

The bank owns Portfolios

Loans, deposits, securities, FX, derivatives — organised the way your institution actually groups them.

→

which contain Products

The instruments themselves — term loans, CP, bonds, swaps, forwards — each with its own cashflows and terms.

→

which create Risks

Every product generates exposure — liquidity, rate, credit, FX, capital — across the risk families.

→

managed by Mandates

Risk appetite, limits and mandates govern those exposures — and TraiQ monitors utilisation against them live.

This Portfolio → Product → Risk → Mandate model is fully configurable to your institution — the names, the groupings and the relationships are yours, not a fixed template.

Risk families

What's monitored and captured.

Each risk family has an authoritative home in the platform — monitored live, with the regulatory methodology behind it and full drill-down to the underlying positions.

Liquidity & Funding

Funding & Liquidity
  • LCR / NSFR live, APS 210 methodology
  • Maturity ladder across every tenor bucket
  • Funding gap & survival horizon under stress
  • HQLA composition and encumbrance
  • Threshold alerts as ratios approach limits

Interest Rate Risk

Interest Rate Risk
  • DV01 by tenor, portfolio and product
  • NII impact — parallel, steepening, inversion
  • ΔEVE under APS 117 / BCBS d368 shocks
  • Re-pricing gap by tenor and currency
  • Hedge effectiveness & residual DV01

Credit & Counterparty

Credit Risk
  • Cross-product exposure aggregated per name
  • Limit utilisation vs approved credit limits
  • Single-name, sector & geography concentration
  • PD / EL / RWA by facility, IFRS 9 aligned
  • Stage migration & NPL monitoring

FX Risk

FX Risk
  • Net open position by currency, consolidated
  • FX VaR — parametric, 99%, 10-day
  • Dealer inventory with live MTM & settlement
  • Forwards & options vs underlying exposure
  • Regulatory NOP limit utilisation

Capital & Regulatory

Capital Risk · Risk Ratios
  • CET1 / Tier 1 / Total Capital with RWA drill-down
  • LCR, NSFR, Leverage Ratio — live, not T+1
  • Stress output across APRA scenarios
  • Capital buffer & headroom monitoring
  • Basel standardised-approach RWA

Securities & Market

Securities Risk · Investment Securities
  • Holdings, yield curves & revaluation
  • Issuer / concentration / HQLA quality
  • Curve-shock revaluation (BCBS d368 / APS 117)
  • Mark-to-market & unrealised P&L
  • Duration & spread sensitivity
Built for your team

Every seat at the table, covered.

Treasurer

Live LCR, NSFR, funding gap, survival horizon. The full picture before the ALCO pack goes out.

Risk Manager

Counterparty concentration, limit utilisation, DV01, RWA, credit migration — every exposure, one dashboard.

Compliance / Reporting Lead

Returns assembled from the live position, reconciled, and variance-checked — with every figure traced to source before submission.

CFO / Board

Capital adequacy, NSFR, LCR trend, stress scenario output. Numbers fit for a regulator.

Why now · Australian ADIs

Why now, for the ADI.

Australian ADIs face rising regulatory pressure, faster-moving markets, and growing expectations for clean, explainable data — the pace spreadsheets and manual reconciliation were never built for.

The bar on returns is rising

APRA expects accurate, well-controlled, traceable data — not numbers hand-stitched across spreadsheets the night before a deadline. Data quality is now its own scrutiny.

AI is reshaping banking

AI is moving from pilot to core infrastructure across the industry. The ADIs that build it into how they see and manage risk now will set the pace others have to match.

Manual reconciliation is where errors hide

Every copy-paste between systems and workbooks is a place a wrong number slips through — and a resubmission or "please explain" is far more costly than catching it first.

Regulatory · Australian ADIs

Built for APRA reporting, too.

The same live positions and risk methodology behind the platform assemble your APRA returns — reconciled, variance-checked and traced back to source before you submit. Every figure carries its own evidence trail — a defensible, documented process, not just a number on a page. Q acts as a second set of eyes across APS 210, APS 117, capital and credit, while your responsible person stays in control of what gets filed.

Built around the standards you report against

APS 210 APS 117 APS 112/113 APS 220

See the platform on real numbers.

Walk through Q, the risk families, and the full balance-sheet model on our demo dataset.